
Update: Humio has been rebranded as Crowdstrike Falcon Logscale
What’s Humio?
Humio is a data (log) analytics platform, that is very similar to Splunk. Humio even supports Splunk HTTP Event Collector (HEC) protocol, making it very easy to migrate log sources from Splunk to Humio.
In 2021, Humio was acquired by Crowdstrike, who uses an outdated version of Splunk as a backend/frontend for Falcon. While the usefulness of their out-of-the box dashboards are questionable, they are in fact based on data collected from Crowdstrike Falcon sensors. I assume Humio is capable of providing similar functionality and I guess that is one of the reasons why Crowdstrike opted to acquire Humio – maybe as part of a strategy to move away from the costs of using Splunk.
Trying Humio
Anyway, Humio has a free offering (Humio Community Edition) which allows you to upload 16GB per day and 7-day retention; which probably isn’t bad for casual homelab use. You fill out a form, and then Humio eventually grants you access to their community edition. After getting access, the first thing I wanted to do was figure out how to onboard some logs. Since I know it supports Splunk HEC, I decided to use td-agent to ship some modsecurity logs to Humio.
How’d you do that?
In a previous blog post, I provide some instructions for installing and configuring td-agent to ship logs to S3. Here, we will configure td-agent to use the splunk_hec ouput plugin to ship logs to Humio’s HTTP Event Collector (HEC).
Note: My instructions differ from Humio’s own fluentd instructions. I tried following those and was unsuccessful in getting logs to ship to Humio. The splunk-enterprise fluentd plugin seems to be outdated, although the splunk-hec fluentd plugin seems to work just fine with Humio. Also, concerning, the token param is not marked as being a secret – so it will show in cleartext in logs. I recommend avoiding fluent-plugin-splunk.
If you haven’t already, you will likely will have to install the splunk_hec fluentd plugin using fluent-gem; you may use the following command:
sudo /opt/td-agent/bin/fluent-gem install fluent-plugin-splunk-hec
To configure fluend to ship logs to Humio, you will need to generate a token. When generating an ingest token, you have to specify the log format associated with that token. In Humio create a repo (as I understand it, a repo is comparable to an index in Splunk). In the example below, I configure fluentd to ship both fluentd and modsecurity logs to Humio.
NOTE: Because Humio enforces a 1-to-1 token to log type mapping, I have 2 match stanzas because the Splunk output plugin (understandably) only supports one token per stanza; The nginx logs are in the access log format, and the modsecurity logs are in JSON, and thus they require separate tokens.
Consider running td-agent in the foreground with (sudo td-agent) to confirm it is attempting to ship your logs; and confirm in Humio that your logs are being ingested.
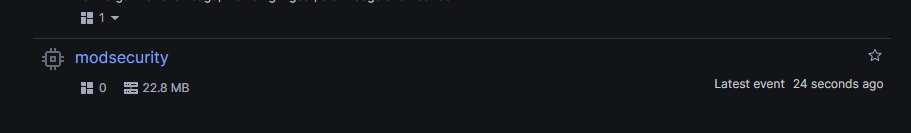
In Humio, if you do not already have logs in your repo, this is easy to eyeball by looking at the “Latest Event Time” value for your repo. index. For example, in the screenshot below, I can see my modsecurity repo received an event at least 24 seconds ago. Alternatively, you can also review the logs in your repo simply by viewing your repo.
My Data is in Humio, now what?
A good thing about humio, is that if it can’t parse logs, it still ingests them and includes an error message indicating why it could not parse the events. You will know if there was an error parsing the event by querying for events where error is set to true.
In my case, I needed to ensure there was a @timestamp field being sent in the top level of the JSON, in UTC format. And because the timestamp in my logs were in UTC but without a timezone indicator in the string, I had to do some manual timestamp extraction (and hardcode the time zone offset) in my fluent configuration. (I probably could have modified the ModSecurity configuration to record the timestamp in a different format – but I wanted to learn more about fluent’s capabilities to do this). Once I resolved this, my modsecurity logs began flowing in perfectly.
Querying Events in Humio
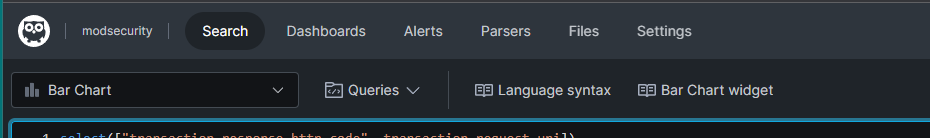
Even if timestamp extraction failed, you are still able to query your ingested logs. Humio defaults to showing results in a tabular format, but you can also change this to see how your data appears in a chart (pie graph, bar graph, scatter plot, etc…). Since finding examples of Humio queries is next to impossible, I’ll be the change I want to see and share one that I wrote to identify excessive HTTP error responses, grouped by source IP address, URI, and HTTP status code:
transaction.response.http_code >= 400
| select(["transaction.response.http_code", transaction.request.uri, transaction.client_ip])
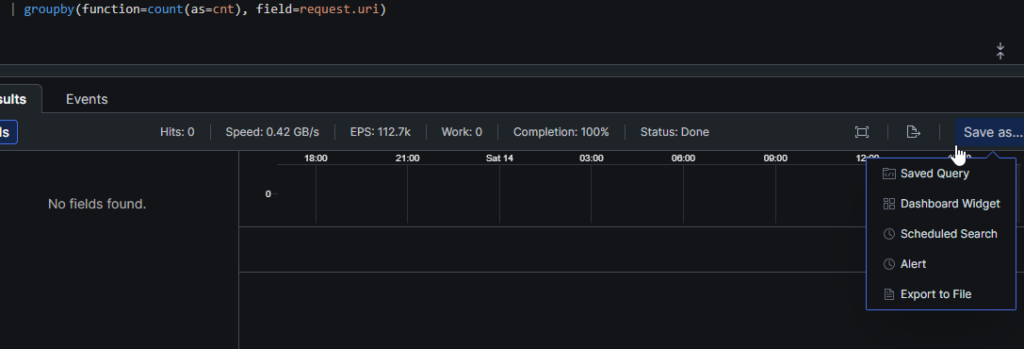
| groupby(function=count(as=cnt), field=[transaction.request.uri, transaction.client_ip, transaction.response.http_code])
| cnt > 5 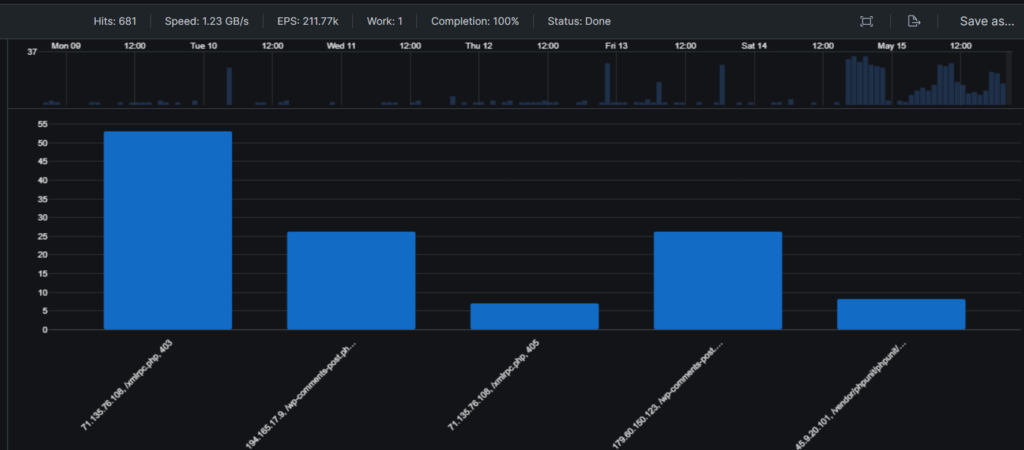
I’ll be the first to say that I’m not a fan of Humio’s querying language. It seems very function-based, and not natural. Syntax hinting in the UI is minimal. Humio provides hints for function names, but no hints for any parameters those functions can accept. If they Humio intended to set their product apart from Splunk, that is definitely one way to do it. Assuming you are not very familiar with Humio, you are likely going to have to keep the docs open in another window. This must be something they are aware of as there is a noticeable link in the search UI to take you their docs on Language syntax.
I am unable to stress test Humio with a large volume of data due to not having any and also the trial has data volume limits, but I can say that searches return results almost instantly for the small volume of data I have uploaded.
Alerts
Like Splunk, Humio implements the concept of Alerts, which are distinct from Scheduled Queries and Saved Queries. What do I mean by that? The process of searching through data and then creating an alert after refining your query is not very intuitive.
At first, you might think you want to save your query – as a saved query or a scheduled search – and then create an alert that simply utilizes the saved query/search. But a saved query cannot be used in a scheduled search nor an alert. And an alert cannot use a saved query or a scheduled query.
With that said, the Humio’s Search UI offers a handy Save as… menu that can save a query as either one of those things. If you want to save a query as scheduled search and an alert, and later need to update the query – for example, to filter out noise, or align with changes in the fields – you would have to update the query in multiple places. Let’s get back to Save as…. though – the location of that button might make you think it will save query results, rather than the query itself. It seems to do all those things.
Alerts can have one more more Actions that send alert details to any of the following destinations, including:
- Humio Repository <insert Inception meme>
- OpsGeneie
- PagerDuty
- Slack
- VictorOps
- Arbitrary Webhook
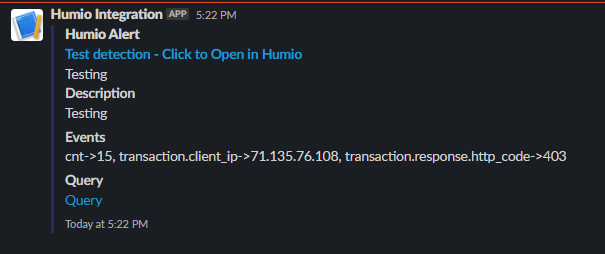
I created an Alert to go to Slack, and apparently there was an issue with the alert – well the Action the alert uses – , this was made apparent by a passive notification in the UI as well as an error message on the alert when you view the inventory of the alerts.
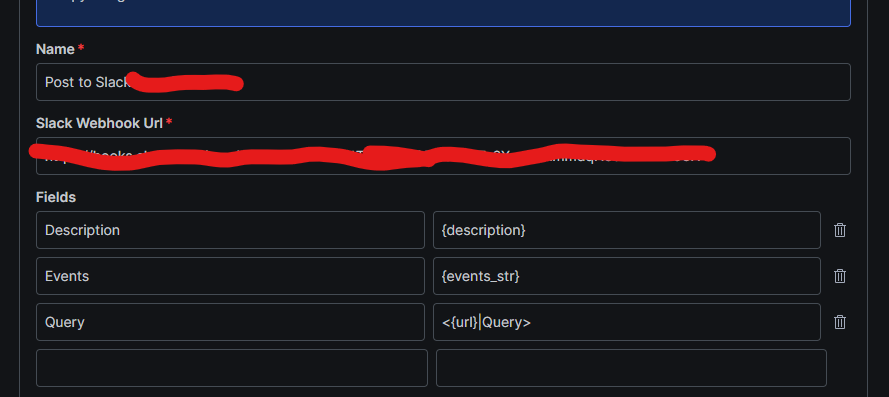
The documentation indicates that it maintains a log of alert errors and warnings, however the documentation provides no guidance on how/where to surface the actual alert details. In my case, the alert was failing due to an issue with the Action to send to a Slack webhook. One of the fields ({events}) that I was attempting to include in the alert apparently botched the JSON. Replacing that field seemed to resolve the issue.
What Else?
There are probably some other capabilities Humio has that I haven’t looked into yet.
- Lookup Tables
- Humio appears to have a Lookup Table capability, but the term used for it in the UI is simply “files”
- Dashboards
- There is the ability to save a query as a dashboard. It looks like queries used for dashboards are also distinct from “Saved Queries”, “Scheduled Queries”, and “Alerts”. This means you cannot create a query, save it, and re-use/point to the saved query for dashboards, alerts, and scheduled queries.
- Data Models/Field Normalization
- I do not see a readily available feature in the UI that could help with normalization of fields in logs. This means you may want to rely on an ETL solution to do field renaming, if that’s a requirement for you.
- Packages
- Humio supports packages (think “add-ons” if comparing to Splunk). There are currently thirty-two (32) packages in its market place.
Conclusion
In my opinion, Humio seems like a lightweight implementation of Splunk, with some room for UI and UX improvements. It’s a decent product for free, personal use; it can be useful for gaining experience with parsing and onboarding logs. It required no infrastructure setup on my part, which is nice. A detection and response team might find it difficult to use Humio efficiently in its current state – particularly when it comes to hunting, creating detections, and potentially tuning in Humio.
Some gaps in Humio I would like to see improved:
- After onboarding logs, writing meaningful queries feels tricky at first. It can be difficult to hit the ground running in that regard because the docs lack example queries for common use cases.
- The inability to save a query and point to that query for dashboards, alerts, and scheduled queries is rather disappointing
- No explicit way to define the severity of an alert, and/or a runbook as a fields in the Alert/Scheduled Search configuration UI. One could likely accomplish this by injecting these values directly into the query results.
- Native support (or a plugin that does) for MITRE ATT&CK tactic/technique mapping
Shanief is a seasoned cyber security professional, with over 8 years of diverse experience in enterprise intrusion detection, response and threat hunting.